Book: Interactive Data Visualization for the Web (2017, 2nd ed.)
Interactive Data Visualization for the Web (2017, 2nd ed.) by Scott Murray is a informative and entertaining read. Murray introduces D3.js (version 4) for designers new to coding who want to visualize data.
Cover
The first couple of chapters (about 60 pages) introduce technological fundamentals like HTML, SVG and Javascript. I think developers with Javascript and SVG experience can skip the first 60 pages. After that Murray covers data, data binding, scales, axes, updates and transitions, interactivity, svg paths, D3 selections, D3 layouts, geomapping (GeoJSON) and exporting charts (to pdf, bitmap, svg).
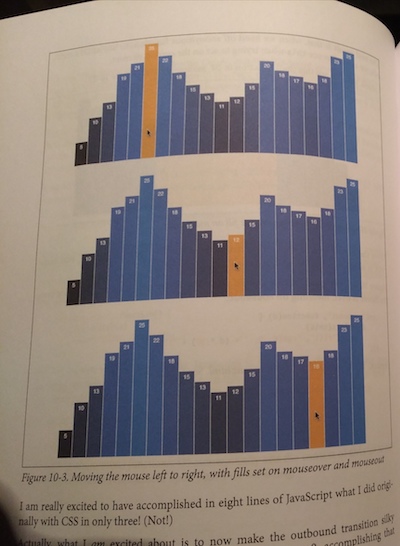
The print edition has full-colored illustrations.
The final chapter is a complete project walk-through wrapping up and applying knowledge from previous chapters to a practical scenario. Scott Murray gives a good D3 introduction in a clear and often humorous style.
Check out the Github code samples of the book to get an impression its topics and examples. I heartily recommend this book.